

With an upsurge of public interest in federal leave, the expansion of paid leave at the state level, and leave claims at an all-time high, understanding the employee leave landscape is more important than ever. As employers build out or evaluate their leave policies, they need to consider many different questions, including:
- Who has access to state-run paid leave programs?
- What type of leaves to include in a leave policy?
- How much leave to offer in a leave policy?
- How much leave do employees take?
Since Sparrow’s inception as the first true end-to-end Leave Management solution, we have worked with hundreds of employers and have managed more than a million days of employee leave. In this report, we share insights gleaned from leave policy and usage data to shed light on the questions above. We also consider broader trends to offer a comprehensive picture of employee leave in 2024 and beyond.
Report Excerpt
We see that the amount of leave taken by employees has increased over the past few years. If we compare the average duration of leaves taken over 2019-2020 to 2021-2022, we see significant increases across all leave types:
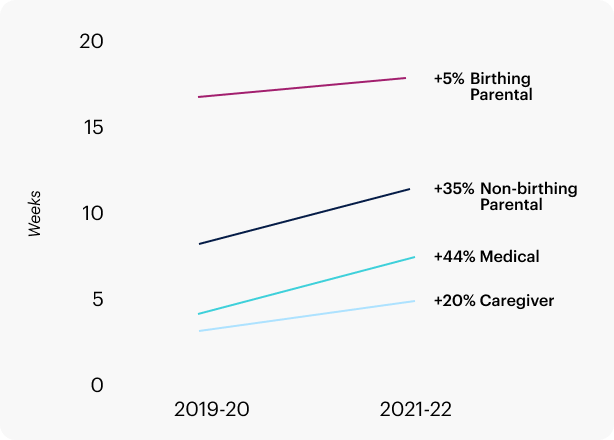
Many underlying factors could be at play behind these trends. For instance, much of this time period coincides with the peak of the COVID-19 pandemic, which affected all kinds of leave, but especially Medical leaves (which saw the greatest increase). The ongoing transition from primarily office-based workforces to hybrid workforces resulted in many employers re-evaluating and evolving their benefits and leave policies during this time. Finally, employee attitudes towards leave and willingness to take leave might have also been a factor.